Debugging Pending changes view performance
Plastic finds changes super-fast. We expect Pending changes to refresh in under two seconds and three to four seconds for bigger projects that have more than 90,000 files in a workspace. Note: The first time that you open it, it will take longer because of some caching and disk monitoring setup.
If your Pending changes is not performing that fast, there is something wrong.
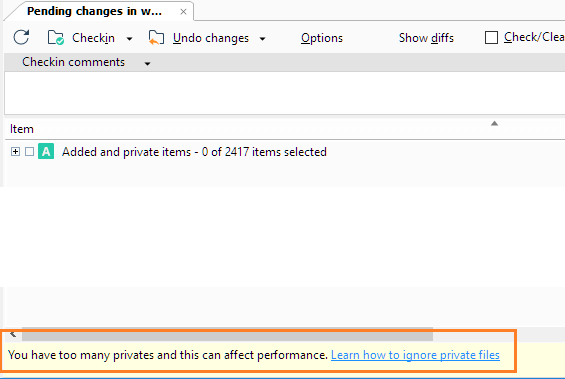
Back in release 6.0.16.960, we added a performance warning in Pending changes when it detects that finding changes is slow. The warning includes a link to the documentation with performance recommendations:
This blogpost explains how to troubleshoot beyond the basics for what might be slowing down your Pending changes view.
Basic Pending changes performance tips
We found that the basic performance issues are typically related to the number of private files in the workspace and some machine preferences.
For more information, see this and this to learn what you can do to improve performance.
Enable the client logs
Sometimes, the above basic tips are not enough. When you still get the warning, you will need to dig into the logs to understand where the discovery time is wasted.
Since the 7.0.16.2074 release, both Gluon and Plastic SCM come with the log activated by default. It is configured in the plastic.log.conf and gluon.log.conf files located inside the Plastic SCM client installation directory, typically under C:\Program Files\PlasticSCM5\client and /opt/plasticscm5/client.
If you have an older release, you can always activate the same log by following these instructions.
Create log data to study
First you need to generate some good logs to later study them.
Follow these steps:
- Close the GUI.
- Ensure logging is enabled.
- Open the GUI.
- Go to Pending changes and wait for it to finish.
- Close the GUI.
You will have a log with enough data to determine why finding changes is slow.
The log file you are looking for is:
- Windows:
C:\Users\<User_name_here>\AppData\Local\plastic4\logs\plastic.debug.log.txt - Linux:
$HOME/.plastic4/gtkplastic.log.txt - OSX:
$HOME/.plastic4/macplastic.log.txt
Study the logs
There is one logger that will give you enough information to understand what is going on. It is called DiskChangesSearcher and you can easily extract info from the raw log file by running:
grep DiskChangesSearcher c:\Users\<User_name_here>\AppData\Local\plastic4\logs\plastic.debug.log.txt
After running the command, you will see something like the following:
GetFsNodeFromPath: 15
GetWorkspaceTree: 31
GetTreeChangedNode: 0
Process changes: 41344
-------ProcessChanges:--------
    timerGetMountPoint 30 ms, 452446 times
    timerProcessChange 3489 ms, 452446 times
            timerIsBinaryPath 3427 ms, 344 times
                    timerIsBinaryTypePredictor 3411 ms, 267 times
    timerGetChangeTypes 2197 ms, 452446 times
            timerGetIgnoredTypes 1801 ms, 386718 times
            timerGetCloakedTypes 126 ms, 452446 times
            timerCheckChanged 32 ms, 56326 times
            timerGetHiddenTypes 0 ms, 2 times
    timerNeedToProcessChildren 155 ms, 452446 times
    timerGetFsNodes 34502 ms, 96642 times
Get changes total time: 41390
Process moved: 0
SplitModifiedMovedChanges: 0
I'll now go through all the timers to explain what they are.
timerGetMountPoint- The time to check the information in the workspace root directory. It does the same for all your workspace xlinks. It shouldn't take a lot of time because it's an easy process.timerProcessChange- The time needed to complete the information for the found workspace changes.timerIsBinaryPath- The time needed to check if the files are binaries or text.timerIsBinaryTypePredictor- The time needed by the operation to find the file type. If you have a lot of custom binary files, this might take a while, and even longer depending on the performance/type of the hardrive. You can accelerate this process by specifying the file extension as text or binary in thefiletypes.conffile.timerGetChangeTypes- The time spent calculating the change type. It checks if the file is on disk, if it's ignored, cloaked, changed and so on.timerGetIgnoredTypesandtimerGetCloakedTypes- The time spent evaluating user configured rules for ignored and cloaked files. If you notice a lot of time spent here, check to see if your .conf files is using complicated rules. If yes, try to simplify them and check to see if this makes a difference.timerCheckChanged- The time spent determining if a file is changed. It will basically check the file size and timestamp. But, if you have the Check content (hash) when the file timestamp is modified with theChangedpreference enabled, it will need to calculate its hash as well, which might take a while depending on your drive.timerGetHiddenTypes- The time spent evaluating thehiddenchanges.confcontent. This is like the Ignore and Cloaked timers. Remember, highly complex rules will impact the process performance.timerNeedToProcessChildren- The time spent working down the directory hierarchy. There normally shouldn't be a problem here.timerGetFsNodes- The time required to ask for the file properties from the disk or the cache. This time is usually key for the operations overall performance. A fast drive will really make a difference; ensure yours is not slowing down the IO operations.Get changes total time- The total time needed to get the changes: Added, Changed, Checked-out, Moved, and Removed. It's the sum of the timers explained above.Process moved- A heuristic applied for the information calculated above to determine the locally moved items. A local move is a removed file matched with a private file as a move operation; it helps to preserve the item history. The more private files you have in your workspace, the more time the algorithm will spend trying to match them as moved.SplitModifiedMovedChanges- The time spent for dividing the items that are changed and locally moved at the same time to show them as two types at the same time. This shouldn't take a lot of time.
Digging into the example log
As you can see from Get changes total time: 41390, the total operation time is very high. The total time is in ms, or in this case 41.4s to retrieve the complete list of workspace changes.
With this info, we can conclude that too much time was spent in the timerGetFsNodes timer; 34 seconds tell us the IO speed is not good. The overall time of the operation would be much better with a better IO drive. Notice that 82% of the total time is spent just trying to read the file system nodes. Also, notice it is not always the fault of the hard drive speed although it is surely related. It might be antivirus software slowing down reading from the disk. Or, it might be that the workspace content is located on a network drive or a shared drive...
Other than the obvious improvement to the IO speed, there are a few minor timers that can be improved as well. For example, 3.4s to detect the file type (timerIsBinaryTypePredictor) for 267 files is way too much. In this case, it also might be due to the IO speed because Plastic needs to read a few bytes of each file to detect its type.
The timerGetIgnoredTypes timer is also slightly high. The cause might be the rules used for the ignore.conf file. Sometimes complicated rules can be simplified to improve the operating performance.
The most common causes for poor performance:
- Slow move detection: This normally happens when you have lots of private and some controlled files deleted. Plastic will try to match deleted/added to find moves and it can take forever. To speed things up, temporarily disable move detection or add the privates you don't care about to
ignore.conf. - Complex rules in
ignore.conf: If too much time is spent here, it means yourignore.confis too complex. If possible, try to avoid regex. - Super slow disk: While SSDs are great to have, good disk HDs perform great too unless there is a process writing like crazy or an antivirus going wild. Very, very often, antiviruses kill good machines. Network drives will also make the operation slower; it is obvious that reading from the network will be slower than reading from a local drive.
- Slow binary detection: We need to read the first bytes of a file to know if it's binary or text. You can speed this process up by specifying the file type, based on the file extension, in the
filetypes.conffile.
Conclusion
I think this is a good starting point for debugging problems with the Pending changes view. My example will differ from yours, but now you should be able to get further with your troubleshooting!
You also learned how to send us the DiskChangesSearcher log info :-)


My workspace has 350,000 files and takes 6s, which seems to be in line with expectations. Can I therefore turn off the constant nagging that it's taking too long, since it isn't ?
ReplyDeleteThis comment has been removed by the author.
DeleteJust edit your client.conf and add an entry
DeleteShowPerformanceWarnings
with value
no
Hope it helps.